Building tools you actually use is a different kind of satisfying. Not toy scripts or one-off exercises, but utilities that fit directly into your workflow. My encrypted journal CLI scratched that itch for personal data security. This time, I wanted to build something that would sharpen my Linux skills while feeding my growing interest in security engineering.
That led to LinuSec: a lightweight, modular Linux security audit tool built inside Ubuntu on WSL. It eventually grew into a hybrid Bash + Python system with a Rich-powered TUI dashboard, clean separation of concerns, and a development process that was genuinely fun.
This post walks through the design, the architecture, and the lessons learned while building it.
Why Build a Security Audit Tool?
I have been spending a lot of time inside WSL building homelab components, experimenting with SOC-style tooling, and getting more comfortable with Linux internals. One thing became obvious quickly: Linux is full of corners you do not think about until you start using it every day.
File permissions. SUID binaries. Cron jobs. SSH configs. World-writable directories. Failed logins. Kernel errors.
You can check all of these manually, but that gets tedious fast. In my experience, you also learn more by building something that ties them together than by running isolated commands one at a time.
So I decided to build a tool that:
- Runs a series of security checks
- Parses and scores the results
- Generates a structured JSON report
- Displays everything in a Rich-based terminal dashboard
I also wanted it to feel like a real project: modular, testable, and easy to extend.
Hybrid Architecture: Bash for Collection, Python for Intelligence
One of the early design decisions was choosing a hybrid model. Bash is perfect for running system commands and collecting raw data. Python is perfect for parsing, scoring, and presenting that data.
So the architecture ended up looking like this:
audit.sh -> runs Bash modules -> produces raw txt
Python modules -> parse txt -> produce JSON
Rich TUI -> reads JSON -> displays dashboard
That separation of concerns kept the project clean. Bash handles collection, Python handles parsing and scoring, and the TUI ties everything together.
Bash Modules: The Raw Data Layer
Each Bash module focuses on one category:
- system.sh
- users.sh
- permissions.sh
- services.sh
- network.sh
- logs.sh
They all follow the same pattern:
#!/usr/bin/env bash
mkdir -p tmp
COMMAND > tmp/module_raw.txt
Nothing fancy. Just Linux commands captured as raw text. This layer does not interpret anything; it only collects.
That simplicity makes the tool easy to extend. Want a new check? Add a new Bash module.
Python Modules: The Brain
The Python modules are where the real work happens.
Each one:
- Reads the raw text
- Parses it into structured data
- Scores severity
- Writes a JSON file
The scoring model is intentionally simple:
- low - nothing concerning
- medium - worth looking at
- high - you should probably fix this
For example, the permissions module looks at:
- SUID binaries
- SGID binaries
- World-writable directories
If there are a lot of them, severity goes up. If there are only a few, severity stays low. It is not meant to replace a full security scanner, just to provide a useful sanity check.
The Orchestrator: audit.sh
This script ties everything together:
- Creates directories
- Runs all Bash modules
- Runs all Python modules
- Combines all JSON into a single report
It is the "run everything" button.
I also ran into the classic WSL issue where pipefail breaks if the shebang is wrong. Lesson learned: always start your scripts with:
#!/usr/bin/env bash
WSL's /bin/sh is dash, and dash does not like pipefail.
The Rich TUI: A Dashboard for Your System
This was the most fun part of the project.
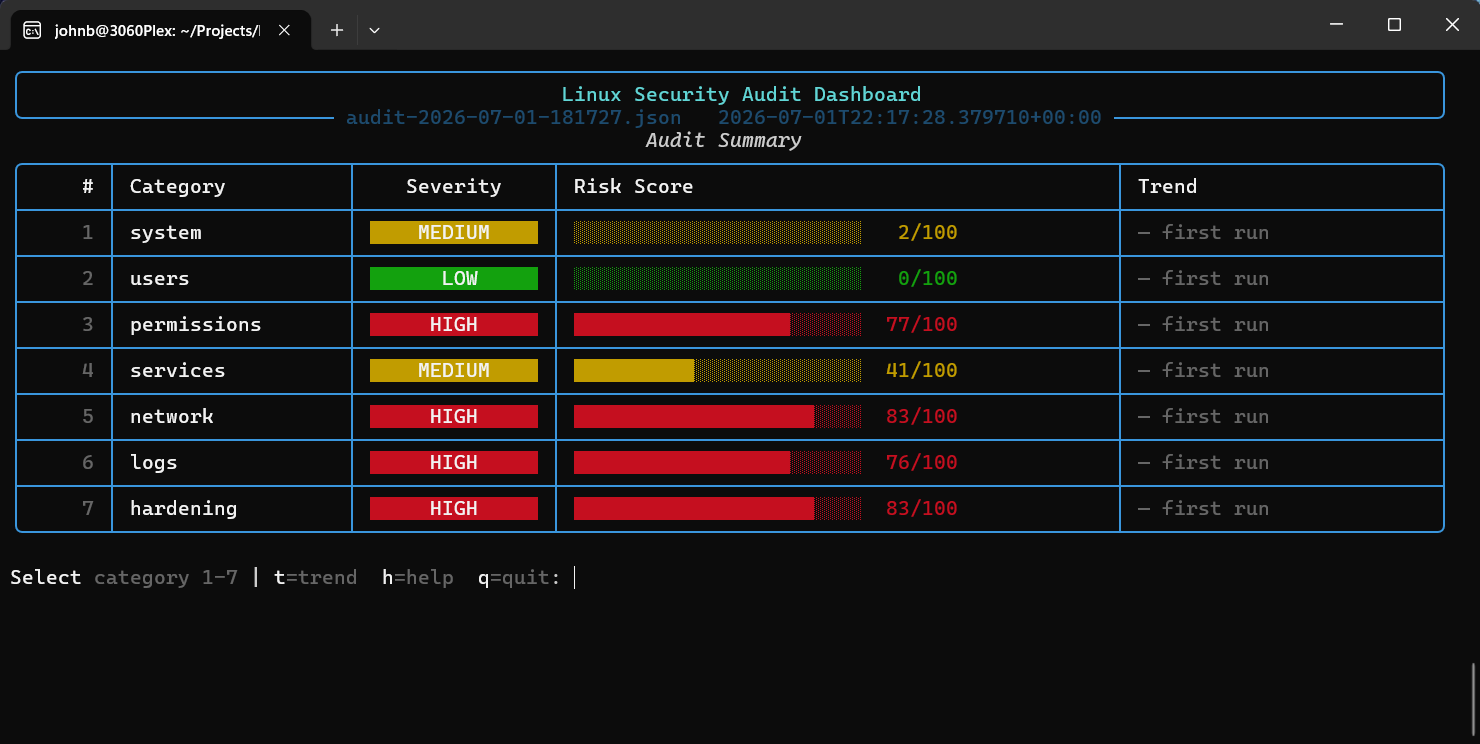
I wanted a dashboard that felt like a SOC console: clean, color-coded, and easy to read. Rich made that much easier. The TUI loads the latest audit report and displays:
- A header
- A summary panel
- Detailed panels for each category
- Severity colors (green, yellow, and red)
- Tables and panels arranged in a Rich layout
Here is the result:
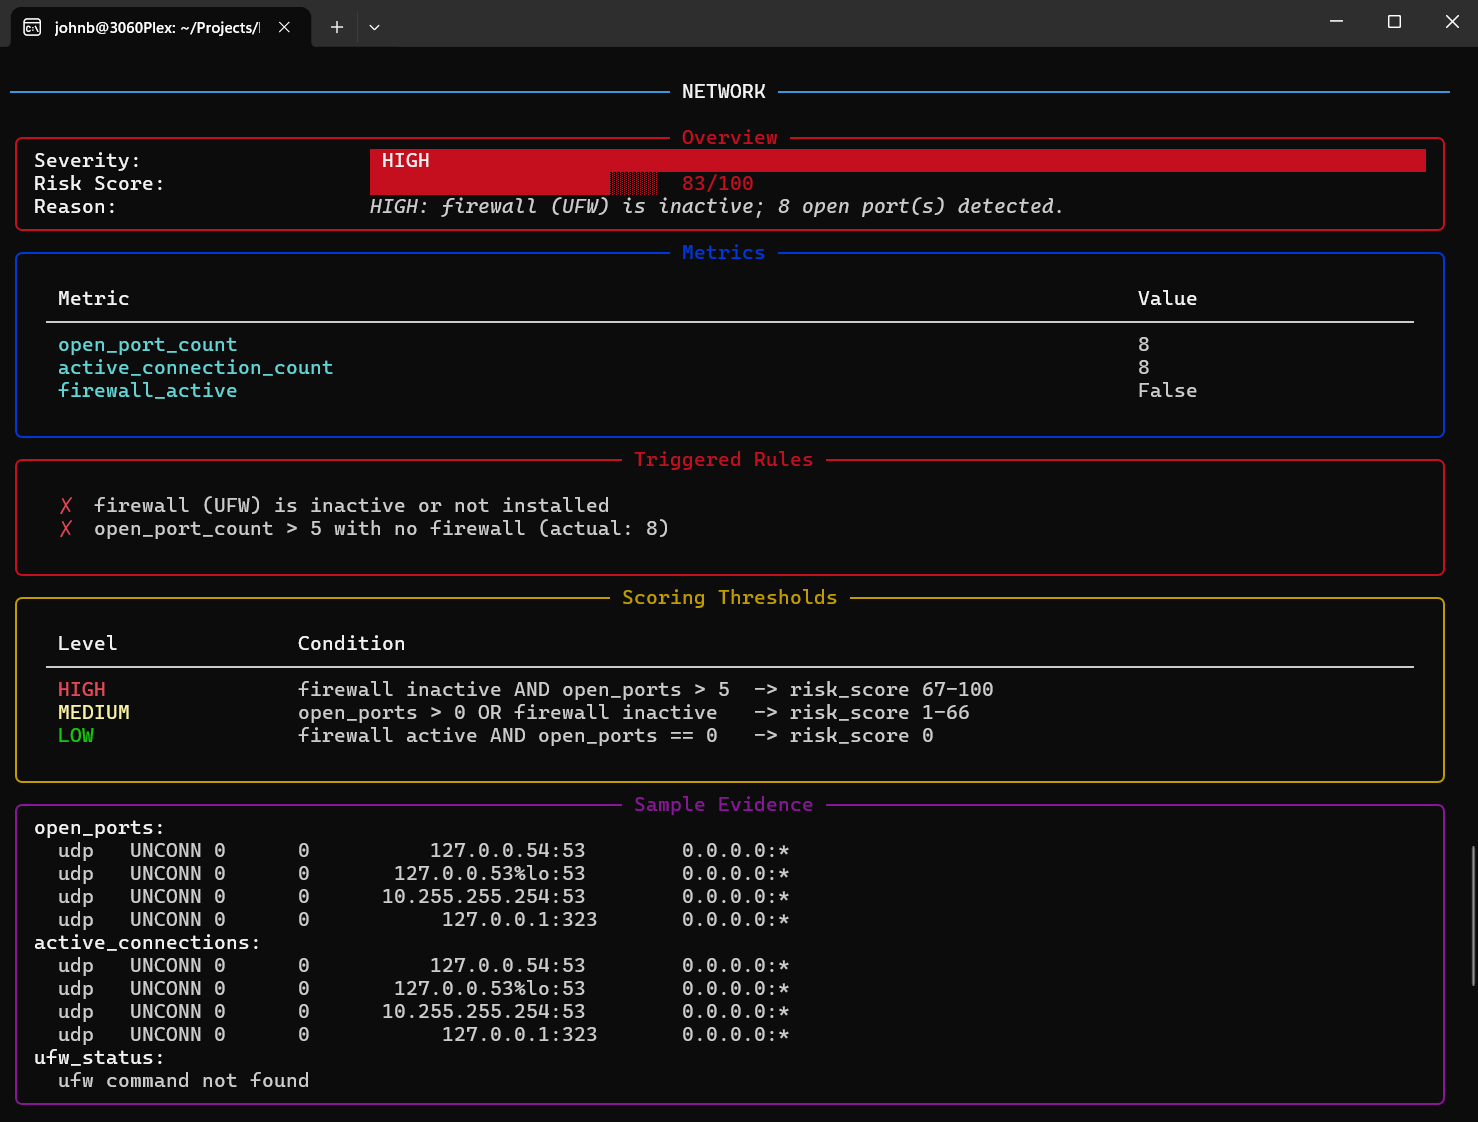
When you select a category such as Networking, you get a more detailed screen showing what caused the warnings:
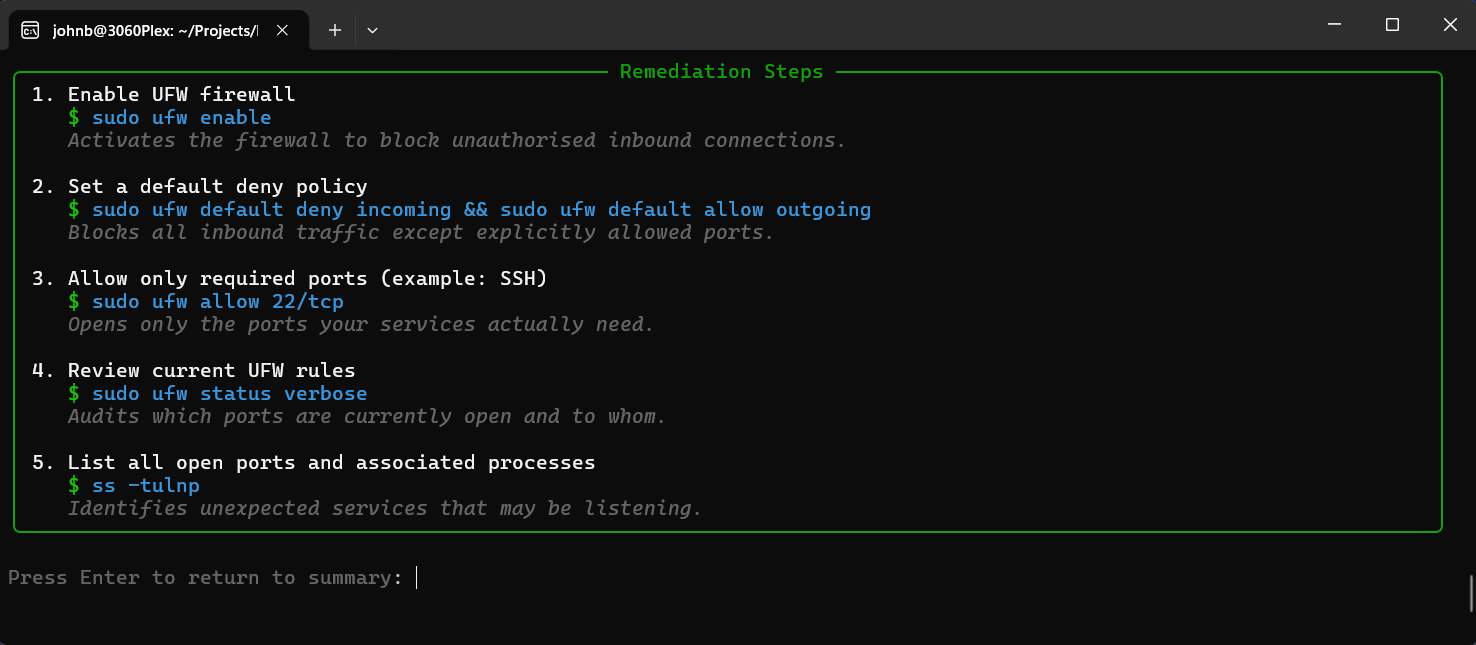
Scrolling down further reveals remediation steps for each issue.
The Trend column updates each time you run make audit and launch the TUI, showing whether your risk score improved or got worse.
It is the kind of interface that makes you want to run the tool just to see the output, which is exactly my favorite kind of script.
Because everything is JSON, the TUI is completely decoupled from the audit logic. You could replace the audit engine entirely and the dashboard would still work.
Lessons Learned
- Hybrid architectures feel great. Bash and Python are a natural pairing for system-level tooling.
- WSL is a fantastic playground. You get a real Linux environment without spinning up a full VM.
- Rich makes terminal UI feel modern. It is hard to go back to plain print statements after using it.
- Modularity pays off. Adding new checks is trivial because each piece is isolated.
- JSON is the universal glue. It makes the TUI, testing, and future integrations much easier.
What Is Next
I already have a few ideas:
- Threat intelligence enrichment
- A live mode that refreshes every few seconds
- A Textual-based interactive UI
- Windows notifications when severity hits "high"
- Integration with my SOC homelab
Even in its current form, the tool is useful. It gives me a quick snapshot of my system's security posture and taught me a lot about Linux internals and Bash scripting along the way.
The best part of building tools is when they teach you something new.